Estimating the Economic Impacts of Tax Increment Financing Districts
Introduction
Representative Susan Estes requested this audit, which was authorized by the Legislative Post Audit Committee at its April 25, 2023 meeting.
Objectives, Scope, & Methodology
Our audit objective was to answer the following questions:
- Do Tax Increment Financing (TIF) projects recover their costs timely?
- How do the estimated economic benefits TIF projects create compare to their estimated costs?
- What are the estimated financial effects of TIF projects on school districts?
To answer these questions, we worked with officials from several of the largest cities in Kansas to compile a list of TIF districts and selected several for review. We then used data from a variety of sources, including property value and tax data from the cities and counties, to conduct various economic benefit estimates and estimate the costs of the selected TIF districts. We used project plan documents to compare estimated and actual timeframes and revenues. We evaluated whether the selected TIF districts were on track to repay their financial obligations. Last, we met with school district and education officials and used data from the Kansas State Department of Education to estimate the impacts the selected TIF districts had on school district funding and enrollment.
More specific details about the scope of our work and the methods we used are included throughout the report as appropriate.
Important Disclosures
We conducted this performance audit in accordance with generally accepted government auditing standards. Those standards require that we plan and perform the audit to obtain sufficient, appropriate evidence to provide a reasonable basis for our findings and conclusions based on our audit objectives. Overall, we believe the evidence obtained provides a reasonable basis for our findings and conclusions based on those audit objectives.
Audit standards require us to report limitations on the reliability or validity of our evidence. In this audit, we used data from a variety of sources to estimate TIF district impacts. In some cases, however, data was incomplete or unreliable which required us to use alternate sources or methods to develop those estimates. Our results based on judgmentally selected TIF projects represent estimates and cannot be generalized to all TIF projects.
Audit standards require us to report confidential or sensitive information we have omitted when circumstances call for that (in other words, we had to mask or not specify information the reader would have expected to get due to that information being confidential). In this audit, we omitted total job numbers for the TIF districts we evaluated. We did this because the job numbers obtained from KDOL are confidential when one business accounts for a large portion of the total jobs.
3 of the 6 TIF districts we evaluated did not recover their costs timely.
Background
TIF districts give cities the ability to designate and help finance development in certain areas.
- The Legislature authorized cities to use Tax Increment Financing (TIF) districts in 1976. A TIF district, also known as a redevelopment district, is a defined area within a city that uses a tax increment to help fund development. When a city establishes a TIF district, the assessed valuation of all existing real property located in the district is effectively frozen at a base level. Any subsequent property tax revenue generated above the base level (either from increases to the value of existing property or from the added value of new property) is called the tax increment. The development can involve building houses or apartments, renovating retail space, cleaning up environmental contaminants, and more.
- State law does not provide clear goals for measuring TIF district outcomes. Rather, it states that the general purpose of TIF is to promote economic welfare and the general welfare of citizens within local communities and the state.
- The general intent of a TIF district is to spur economic development that ultimately pays for itself. Ideally, improvements within a TIF district will increase property values and generate additional tax revenue. The city can then use this additional tax revenue to pay off its TIF obligations. In this way, a city can leverage the future tax revenues of a TIF district to help pay for development that may not have occurred otherwise.
- Private contractors and cities work together on the development of a TIF district. The developer agrees to build structures and develop infrastructure within the district according to a project plan, and the city agrees to help pay for some of the costs. Statute outlines the types of costs that can be paid by the city. These costs include acquisition of property, site preparation, utilities, and infrastructure. The developer pays for all other costs of development, which are generally larger than the city’s costs.
- Cities have the power to create and administer TIF districts on their own. They do not need to work with a state agency or any other governmental entity. However, counties and school districts that may be impacted by a proposed TIF district can veto its creation if they believe it will have adverse effects.
Before development can take place, cities must establish and approve both a TIF district and TIF project.
- A TIF district is the defined area of land within a city in which a TIF development project occurs. Cities can establish TIF districts in statutorily eligible areas, which include blighted areas, commercial areas, conservation areas, and several others. Development takes place within the district’s boundaries, and these boundaries also form the area from which a tax increment is collected. TIF districts are also referred to as “redevelopment districts.”
- A TIF project is a body of work that encompasses the physical development that takes place within the district. A TIF project plan is a document that outlines the project and describes the intended development. It includes a feasibility study, a description of the planned sitework and construction, and project timelines. The feasibility study describes the expected impact of the TIF project on tax revenues and whether the tax increment will be sufficient to cover the city’s costs.
- To begin development, the governing body of a city must first propose and approve the boundaries of a new TIF district. Once the district is approved, the city council must then propose and approve a project plan with a 2/3 majority vote. Throughout this process, the city must provide information and hold hearings to give the public a chance to review the proposals.
A variety of entities are involved in the creation of TIF districts, but cities are the chief decision-makers.
- Statutorily, cities are the sole entity responsible for the creation and administration of TIF districts and projects. Cities are also one of the primary entities affected by the tax increment and the outcomes of development. Cities have the most financial stake because they are the only entities that can take on debt to help finance a TIF district.
- Counties and school districts have a limited role, but they are still affected by TIF project outcomes. When a city proposes the creation of a new TIF district, the counties and school districts in the TIF district are notified. They can veto its creation if they believe it will cause an undue hardship or have negative impacts on them. Counties and school districts have this veto right because the tax increment also affects their tax base and revenues. The specific TIF project plan isn’t created until after the veto period, however. As result, counties and school districts may not be aware of the project details before they make their decision.
- Private companies are usually the primary developers of TIF districts. Generally, the city either seeks out potential developers or developers come to the city with a redevelopment plan and a request to use tax increment financing. The developer and city then enter into a contract with one another. This contract usually outlines the structures and infrastructure that are to be built by the developer, as well as how much of the development is eligible to be done or paid for by the city.
- The state does not exercise oversight of TIF districts or keep records of them. The only role the state plays in TIF is through the statutes that govern eligibility, creation, and taxing procedures. However, the state could still be affected by the outcomes of a TIF district, such as receiving more or less sales tax as a result of development.
Cities have flexibility in how they finance TIF districts, and they can generate revenue to cover TIF costs from several sources.
- Cities can finance their portion of TIF projects in different ways. The 2 most common are pay-as-you-go agreements and the sale of bonds:
- With pay-as-you-go agreements, the developer requests reimbursements from the city for their TIF-eligible costs while development is ongoing. The city makes these reimbursements with the TIF funding they’ve generated at that time.
- With the sale of bonds, cities take on debt to generate an upfront pool of funds they can use at any time to pay for their costs, such as reimbursing the developer for TIF-eligible work. Cities then pay back the bond over time, both during and after development. Bonds allow cities to pay for their portion of the project costs and reimburse developers much earlier, but the city also must pay interest on these bonds.
- One of the primary ways that cities generate funding to pay for their TIF costs is through the property tax increment. The property tax increment is the property tax revenue generated on the assessed valuation above the base level from when the district was first created. Cities can use all or a portion of this tax increment to pay for their TIF costs, including reimbursing developers or paying down bonds.
- Cities can also generate TIF funding through other taxes and revenue sources within the TIF district. For example, they can collect revenue from taxes on hotel stays (called transient guest taxes) and franchise fees. Furthermore, cities can use their sales tax revenue from inside and outside the district for TIF funding. They can also use all or a portion of the sales tax from the district that would normally go to the county, with the county’s permission.
- Other economic incentives can be used in combination with TIF. For example, a city may create a TIF district that also uses Industrial Revenue Bonds, STAR bonds, or other economic incentives to assist with development.
The legislature has broadened the financing and duration of TIF districts since 1976, and areas eligible for TIF have been steadily expanding.
- The original 1976 TIF Act restricted the use of TIF districts to blighted, downtown commercial areas. However, from 1982 to 2016, this restriction was gradually reduced. Now, cities can establish TIF districts in numerous eligible areas, including enterprise zones, conservation areas, and major tourism areas.
- In 1993, the legislature expanded the law to allow cities to use sales and other taxes generated from taxpayers doing business within the district, such as taxes paid on hotel stays to pay for their TIF obligations. In 1996, the legislature expanded the law again to allow cities to help finance TIF costs from sales taxes generated anywhere in the city.
- In 1998, the legislature extended the allowable duration of TIF districts. Prior to 1998, TIF projects had to be completed within 20 years of the establishment of the TIF district. In 1998, the legislature changed this 20-year limit to begin with the approval of the TIF project itself, not the district. A TIF project is “complete” when this time limit is reached or when development has finished, and the city’s costs have all been paid. Once complete, a district no longer functions with tax increment financing.
- In 2001, the legislature changed the law again to allow cities to collect the property tax increment once the TIF district was established. Prior to this, cities could only collect the tax increment after the project was approved. Together with the 1998 change, this means that cities can begin collecting a property tax increment immediately after the creation of a TIF district. They can continue collecting this increment for an indefinite period of time before approving a TIF project.
- As a result of these changes, cities can create, use and finance TIF districts much more broadly than in 1976. Many more areas are eligible for TIF districts, and cities have access to additional sources of revenue to help finance TIF projects.
Generally, TIF districts are intended to recover their costs by increasing the property value and tax revenue to the city in the longer term.
- Figure 1 demonstrates the relationship between the tax increment and the base year assessed valuation. As it shows, the base year assessed valuation is established when the city creates the TIF district. The property tax increment is then calculated as the tax generated on the assessed valuation above the base. The increase in assessed valuation can come from value added from the development or from the natural value growth of existing property. Taxpayers within the district pay their property taxes like normal; the only difference is the tax increment amount is separated out and distributed to the city for their TIF costs.
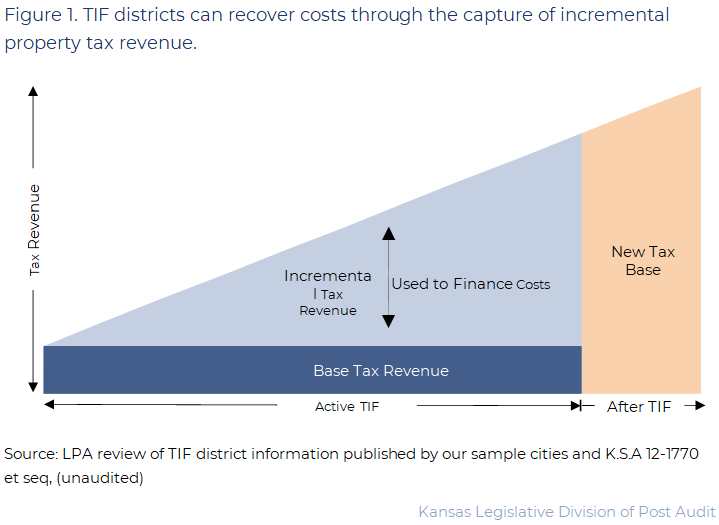
- For example, if a city creates a TIF district in 2010 and the assessed valuation of its properties at that time is $100,000, then the base year valuation for the TIF becomes $100,000. If the assessed valuation the next year is $120,000, the landowners pay the full tax on this assessed valuation. The tax generated on the additional $20,000, however, is the property tax increment. It is separated out, and the city can use it to help fund their TIF costs.
- Cities can capture and use the property tax increment from all taxing subdivisions within the TIF district (county, school district, etc.), but there may be exemptions in certain situations or for certain levies. Cities can use 100% of the increment above the base valuation, or they can choose to only use a portion of this increment. The city can only use this increment to pay for their TIF costs, however. If they collect a tax increment, then the cities hold the money in a special fund until they can use it.
- The city’s costs for a TIF district are intended to pay for themselves. This is partly because TIF development generally causes an increase in property values. This increase results in a tax increment and a higher tax base after the district is complete. Therefore, the city’s TIF costs can be offset and potentially exceeded by these tax gains.
- If the use of TIF is necessary to bring about a development, then that development may increase tax revenues enough to pay for the city’s costs and more, resulting in a net positive return for the city. However, if the development would happen in its entirety without the use of TIF, then the city may end up reducing its net return by using TIF. That’s because it would be taking on costs that weren’t required to bring about the development.
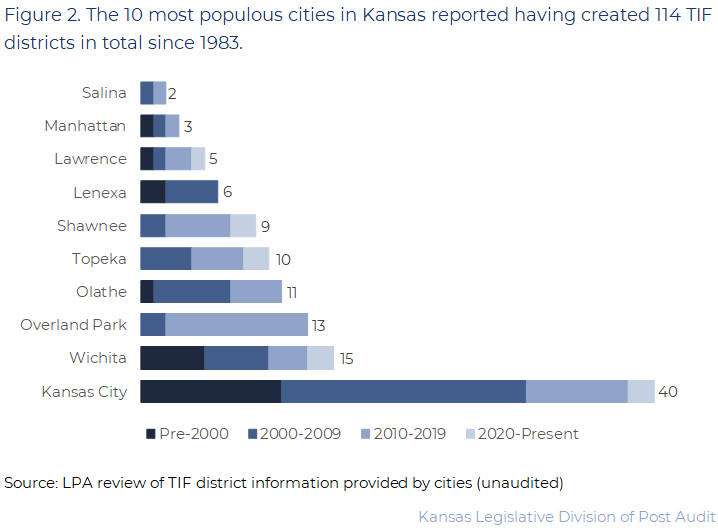
The 10 largest cities in Kansas reported having a total of 114 TIF districts.
- There is no central repository or database for TIF districts. Rather, TIF districts are created and administered by individual cities who maintain their own records. As such, we reached out to the 10 most populous cities in Kansas (Wichita, Overland Park, Kansas City, Olathe, Topeka, Lawrence, Shawnee, Lenexa, Manhattan, and Salina) to compile a list and to select 6 districts for our economic analyses.
- Figure 2 shows the distribution of TIF districts by city and decade of creation. The 10 cities reported having created 114 total TIF districts since the inception of the TIF Act. Of the 114 districts, 38 (33%) were reported as having been completed or terminated, and 76 (67%) were reported as currently ongoing. As shown in the figure, Kansas City reported having the most TIF districts at 40 (35%), while Salina reported having the fewest at only 2 (2%).
- The cities also reported a description for each TIF district and their associated projects. These descriptions allowed us to assess the general purpose of the TIF districts and the type of TIF projects they were paired with. The most reported types were:
- 38 mixed-use TIF projects (both commercial and housing developments).
- 21 retail TIF projects (primarily commercial development).
- 12 residential TIF projects (primarily housing development).
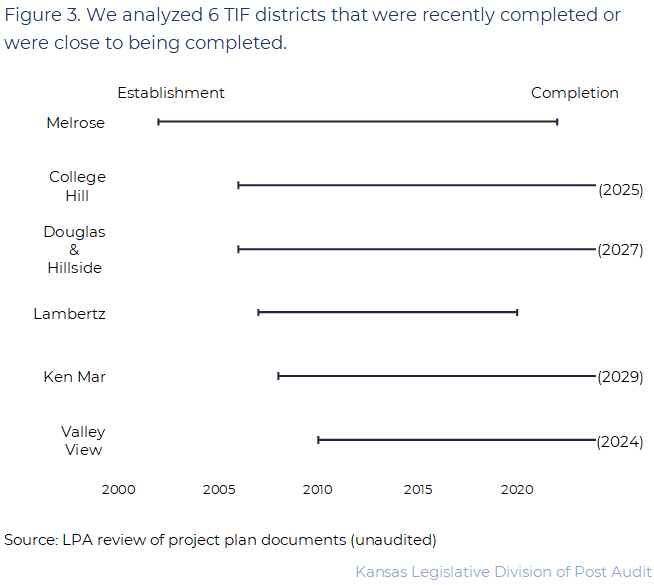
We evaluated 6 TIF districts from 5 different cities to evaluate their economic impacts and the timeliness of their cost recovery.
- We judgmentally selected 6 of the 114 TIF districts for our economic impact analysis. We selected these districts to represent various geographic locations and project types. We believe our selection is a reasonable cross-section of the city-reported TIF districts. However, given the small sample size, our conclusions cannot be projected to all TIF districts. The 6 TIF districts we evaluated were located in 5 cities:
- Melrose (Kansas City): this is an industrial (business and industry) district that was created in 2002. It was completed in 2022.
- College Hill (Topeka): this is a mixed-use district (with a large residential component) that was created in 2006. At the time of our report, it was still active.
- Douglas & Hillside (Wichita): this is a mixed-use district (with a large residential component) that was created in 2006. At the time of our report, it was still active.
- Lambertz (Salina): this is a retail district that was created in 2007. It was completed in 2020.
- Ken Mar (Wichita): this is a retail district that was created in 2008. At the time of our report, it was still active.
- Valley View (Overland Park): this is a retail district that was created in 2010. At the time of our report, it was still active.
- Figure 3 shows when each of these districts was created and when they were completed or are estimated to be completed. A district is “completed” when the city’s TIF-eligible costs have been fully paid off. We selected TIF districts that were completed within the last decade or were created more than a decade ago. We did this because TIF districts outside of this range may lack data or be too new to measure outcomes.
- We excluded some TIF districts from our selection for a variety of reasons.
- We excluded TIF districts for which the city had identified an overlapping incentive, such as an Industrial Revenue Bond. We did this to avoid potential confounding factors from other incentives and to more directly assess the economic impacts of the TIF incentive itself.
- We also did not select TIF districts that were terminated shortly after creation because there likely would not have been sufficient data to make estimates in those cases.
- Last, we chose not to select TIF projects that were very narrow in scope or for which it would have been difficult to conduct a robust economic analysis. For example, we did not select a project the with the goal of constructing a parking garage.
TIF District Timeliness of Cost Recovery
We reviewed project documents and tax records to determine the construction and financing timelines for the selected TIF districts.
- Before creating a TIF district, a city must create and issue a project document and feasibility study, among other planning materials. These documents serve as estimates for various aspects of a TIF project, including:
- Time for Construction: how long it will take the developer to complete the planned development for the TIF district.
- Financing: how much TIF development cost the city and how long it will take the city to recoup its costs from TIF revenue. Financing has 2 components:
- Costs: this includes what the city estimates it will have to pay for its portion of development. For example, if the city takes out a bond to reimburse the developer for some of the work, its costs include principal and interest to pay back that bond.
- Revenue: this includes any revenues the city estimates it will gain in to pay for its TIF costs, such as revenue from tax increments. This is revenue generated while the TIF district is active.
- We gathered data and documentation from cities and counties to determine the planned duration, city costs, and revenue for each of the TIF districts we selected. We gathered additional data to establish the actual duration, cost, and revenue of each TIF district. We compared these amounts to the planned amounts to determine whether the TIF district recovered its costs timely.
- Timeliness is not a sole indicator of whether a given TIF district is a “success.” For example, if it takes longer than estimated for a TIF district to earn enough revenue to cover the city’s costs, it may be that the estimates were flawed or too optimistic. It’s important to remember we did not analyze the actual amounts and values with respect to how much a TIF project should have cost or how long it should have taken to cover those costs. We relied only on the estimates provided in the planning documents at the start of the project.
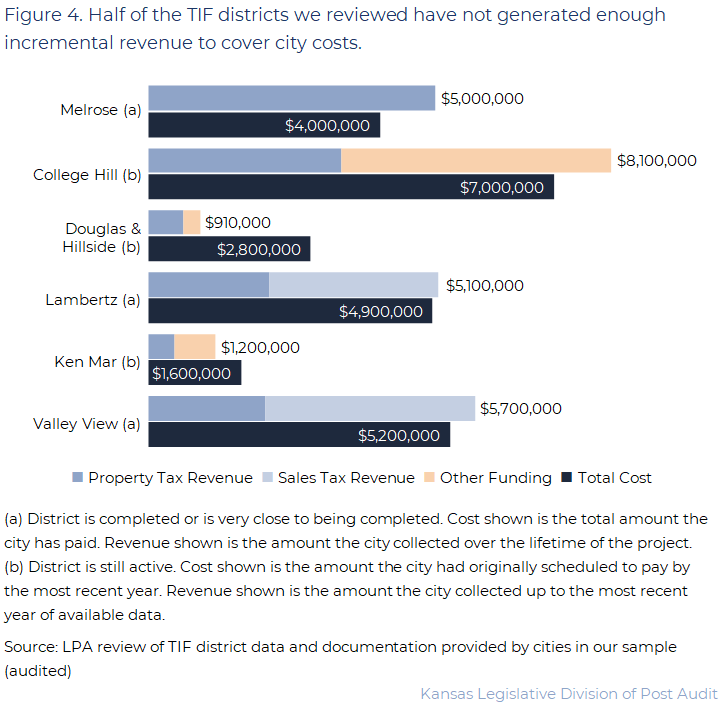
3 of the 6 TIF districts we reviewed are not expected to pay off their TIF costs on time or have not generated enough revenue to cover these costs.
- 5 TIF districts used bonds or other debt instruments like loans to help finance their portion of the TIF development costs. The Valley View (Overland Park) TIF district was the only one that used a pay-as-you-go method to reimburse the developer directly with TIF revenue.
- The Lambertz, Melrose, and Valley View TIF districts have paid off or are on track to pay off their city costs on time. Figure 4 lists the current total city costs and incremental tax revenue generated for each of the TIF districts in our selection. As it shows, these districts have also been able to fully recover their costs from TIF revenues, such as property tax increments. In the case of the Lambertz and Melrose TIF districts, Salina and Kansas City used debt financing to pay for costs up front. These debt payments have been made on time with TIF revenues. In the case of Valley View, Overland Park reimbursed the developer directly for city costs incurred while development was ongoing. These payments have also been completed on time with TIF revenues.
- For the College Hill TIF district, the city of Topeka is on track to pay off its costs on time. However, it is not fully recovering its costs through TIF revenues. The city is using general funds to help finance debt costs for this district. In total, we estimate that about 40% of College Hill’s total city costs will be covered by city general funds. As a result, the city may not be able to spend that funding elsewhere.
- Both Wichita TIF districts (Ken Mar and Douglas & Hillside) are not on track to pay off their TIF costs on time. The city has explained that delays in construction and shifting development timelines were reasons why the debt repayment has been later than they estimated. Furthermore, the amount of TIF revenue generated for both districts has been lower than originally estimated. Wichita has also made use of non-TIF funds to help finance debt costs for both districts.
- As of 2022, the Douglas & Hillside TIF district was about $1.8 million behind in covering scheduled debt service payments. City officials said they expect the financial condition to improve and the debt to be fully financed by 2027.
- As of 2022, the Ken Mar TIF district was about $420,000 behind in covering scheduled debt service payments.
- If a city cannot pay off debt obligations on time, then its overall cost from the TIF project may increase as it accrues additional interest. The use of other city funds to help cover shortfalls may leave less funding for other purposes.
All 6 of the TIF districts we reviewed are on track to be at or below estimated costs, but most experienced delays in construction.
- For all 6 TIF districts we reviewed, city costs are on track to come in at or below project estimates. This means that the total amounts the cities have paid are currently at or below the amounts they had estimated prior to the creation of the TIF district. This includes payments for reimbursing developers for city costs and/or paying back bonds.
- The average total cost to cities thus far for the TIF districts we reviewed is around $3.8 million. Currently, the most expensive TIF project we reviewed is the College Hill (Topeka) TIF district, for which the city had paid about $6.5 million toward TIF-eligible costs as of 2022.
- Most TIF districts we reviewed took longer to complete than cities originally planned. The development project for the Lambertz (Salina) TIF district was completed early. The development project for the Melrose (Kansas City) TIF district was completed on time. The other 4 TIF districts, however, experienced delays and were completed later than expected. Delays in construction at any phase can delay the accumulation of tax increment revenue.
- In some cases, these delays may have been partially due to unforeseen complications with the development plan. For example, the College Hill (Topeka) TIF district experienced construction delays because the developer had trouble selling some property within the district early in the project.
The 6 TIF districts we reviewed generally experienced economic benefits such as increased property values and jobs, but whether these benefits are worth their financial costs is subjective and often project-dependent.
Cost Estimates
There are both direct and indirect financial costs to cities that use TIF.
- TIF district associated costs can be categorized as follows:
- Direct costs are the direct payments and reimbursements the city makes to pay for TIF-eligible expenses. This includes reimbursements made to the developer and principal and interest payments made to pay back debt obligations. Generally, cities use funding generated from the tax increment to make these payments, but they can also use other city funds, such as general funds.
- Indirect costs are any additional costs to the public that come about as a result of TIF development. Often these include additional infrastructure and service costs that are required to maintain the development. For example, new development may require an additional stoplight to handle increased traffic or a new fire station to cover more residences. For this analysis, we used data provided by city police departments to analyze the crime rates from before and after the TIF district was created. Increased crime rates could create potential indirect costs by increasing the demand for public services like police. We were unable to estimate other measures of indirect costs due to a lack of available data.
- Opportunity costs are the benefits a city could have gained by spending its money in other ways (or not at all instead of on TIF development). For example, if a city had not created a TIF district, it may have received additional tax revenue absent the base assessed valuation freeze. Additionally, property values may grow naturally without TIF development and generate additional tax revenue. We used property value and tax data to estimate the benefits of property value and tax growth relative to the opportunity cost of foregone value and tax growth in the absence of TIF development. We were unable to estimate other opportunity costs due to a lack of available data.
- There is another concept related to the cost of economic incentives referred to as the “but-for” percentage. Essentially, this is an estimate for how likely it is that the development would have occurred without the city’s use of the incentive. The economic rate of return on the city’s costs is tied to this but-for percentage. Accurate estimation of the but-for percentage, however, is very difficult and requires substantial amounts of data. Furthermore, whether or not development would have occurred in the case of an individual TIF district is an inherently unknowable question. It depends heavily on the private business decisions of the developers themselves. For these reasons, we did not analyze the “but-for” percentage for this question.
For the TIF districts we reviewed, cities have incurred between $1.6 million and $7.0 million in direct costs.
- The direct cost of a TIF project is the most straightforward and immediate cost paid by cities. It can be calculated by simply adding up the total amount of payments a city has made toward TIF costs, including developer reimbursements and debt servicing.
- As shown in Figure 4, the direct cost to cities for the TIF projects we reviewed ranges from $1.6 to $7.0 million. This direct cost is what the cities were scheduled to have paid in total TIF costs by the most recent year of available data. The most expensive TIF district in terms of direct cost is College Hill in Topeka. The least expensive is Ken Mar in Wichita.
- For TIF districts that are still active, direct costs may increase by the time the district is completed. This is because the cities may end up incurring additional costs from things like interest on debt.
4 of 5 TIF districts we reviewed experienced an increase in crime rates after development, which could lead to indirect costs from increased public service demand.
- Increases in crime could increase demand for public services like police, which could increase costs to the city. Crime rates in the 5 TIF districts we evaluated represented a very small fraction of the overall crime rates of their respective cities.
- Figure 5 shows a comparison of crime rates from before and after the TIF districts we reviewed were created. As the figure shows, reported crimes increased for 4 of the 5 TIF districts for which we had crime data. Most of the crimes in these districts were property crimes such as theft and vandalism. While some types of crime (e.g., violent crime) decreased for some TIF districts, almost all of them experienced higher property crimes. For example, the Valley View (Overland Park) TIF district experienced a 60% increase in total crime rate after development, which was partly driven by an increase of 75% in property crime rate. We were unable to analyze crime data for the Melrose (Kansas City) TIF district due to the data being unavailable at the time of the audit.
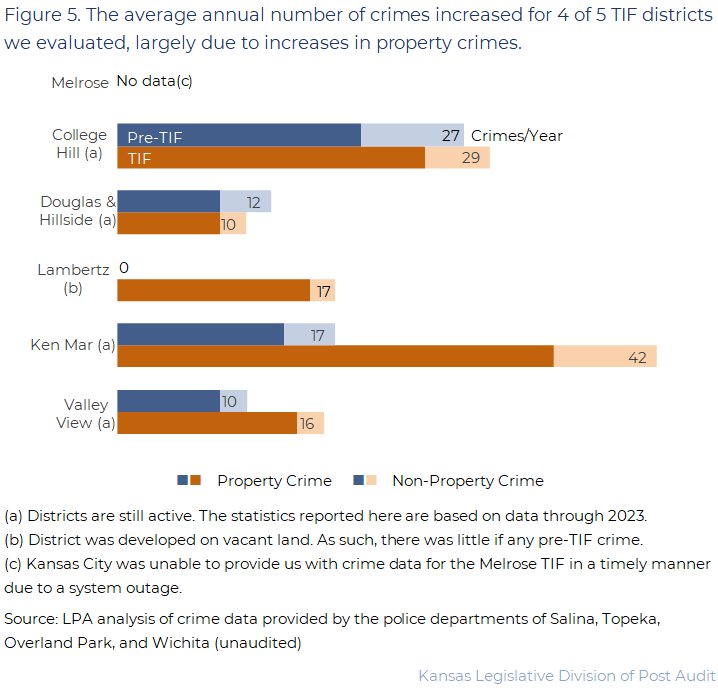
- The Douglas & Hillside TIF district experienced a small decrease in crime overall after the district was created. However, this may be partly due to a delay in construction that lasted until 2016. Crime numbers increased shortly after that, indicating that the TIF development may ultimately result in higher crime rates in the district.
- It makes sense that crime rates increased for most TIF districts after development. Commercial development may bring more people to the area, which could lead to increased crimes from activities like shoplifting and theft. Residential development may also increase the number of people in the area, which could increase the rate of crimes as well. However, we cannot know for certain to what extent development caused these changes in crime rates. Similar changes in crime rate may also occur with other kinds of development, regardless of whether TIF is used.
- There is limited research that examined the tradeoffs and impacts of TIF and other economic incentives with respect to the cost of public services. However, 3 studies we reviewed indicated TIF projects can increase the need for public services such as fire, sanitation, police, and transportation. The increase in public service needs can increase indirect costs to the city and taxpayers, but these effects may vary depending on the type of development. However, given that these districts are very small in physical and financial size compared to the cities, it is unlikely that they caused significant increases in public service costs.
Economic Benefit Estimates
We conducted a variety of analyses to estimate the potential economic benefits of TIF districts.
- The economic benefits of TIF development can vary depending on the specific outcomes of the TIF project. A residential TIF district, for example, may have very different outcomes (e.g., more housing) than a commercial TIF district that brings in a new shopping center (e.g., more economic activity). There is no singular economic analysis that can capture all of the potential benefits of TIF district development.
- To capture a variety of potential impacts of TIF development, we conducted the following analyses for the 6 TIF districts we selected:
- Property and Tax Analysis: we compared the growth in property values and property tax revenues within the TIF district to our estimates of what they would have been had no development occurred. This allowed us to estimate potential benefits relative to the opportunity cost of the natural growth in property value and tax. For this work, we used city and county property and tax data.
- Development Analysis: we compared the development and property value growth within 0.25 miles of the TIF district boundaries. This helped us to estimate potential benefits from spillover effects. Additional development and increasing property values in neighboring areas can result in even more tax revenues. For this work, we used historical aerial imagery and neighboring property data.
- Employment Analysis: we compared the total employment within the TIF district from before and after its creation. This helped us estimate potential job creation benefits. Due to data limitations, we were unable to estimate the financial value of these jobs. Still, additional jobs may indicate an increase in economic activity, which can lead to additional income and sales tax revenue. For this work, we used data from the Kansas Department of Labor.
- We considered other types of analysis for our economic impact estimates, but some were unfeasible due to data limitations. For example, the U.S. Census Bureau’s housing data was not granular enough for us to study changes in housing availability. Lack of data also prevented us from evaluating increases in sales tax revenues for the commercial development in TIF districts.
- Appendix B includes more information about the methodology for each analysis, including data sources and time frames.
For 5 of the TIF districts we reviewed, the development resulted in a significant increase in property values and resulting tax revenues.
- We estimate that 5 TIF districts experienced a significant increase in property values and property taxes above what likely would have happened without the TIF development. Figure 6 compares property value growth and tax revenue growth with TIF development and without TIF development. Our estimates of what would have happened without TIF development are based on the growth in property values prior to the creation of the TIF district. As such, these estimates are relatively simple and do not account for other variables that could have impacted growth.
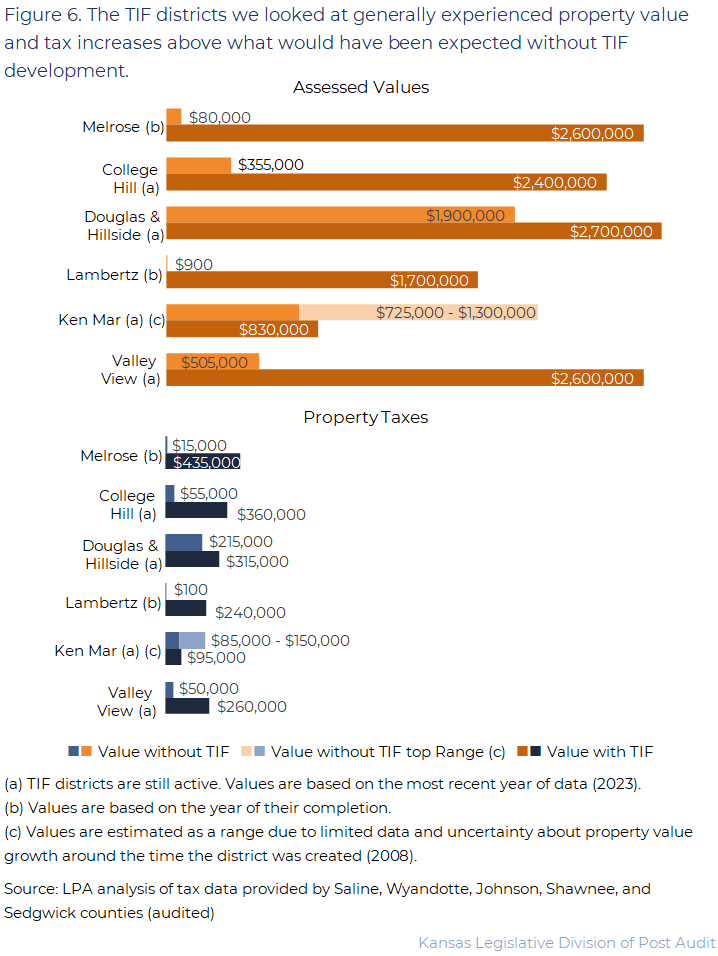
- For example, the Lambertz (Salina) area was an open field in a flood plain prior to the TIF district. We estimate the district would have only grown from an assessed valuation of about $700 in 2008 to $900 in 2020 without the TIF development. In 2020, the year the TIF district was completed, we estimate that it would have only generated $100 in total property taxes. With the TIF development however, the assessed valuation of the district was $1.7 million in 2020. In that year, it generated about $240,000 in property taxes.
- The Ken Mar (Wichita) TIF district is the only district in our selection that may not generate more tax revenue than it would have without TIF development. It was created in an area already developed with some retail space. The assessed valuation was $830,000 in 2023. Without development, we estimate the property would have grown from an assessed valuation of about $495,000 in 2008 to between $725,000 and $1.3 million by 2023.
- In general, the development brought about by the TIF districts we reviewed increased the real property values in the districts. This increases the tax base and therefore raises tax revenues for the city and other taxing authorities once the TIF district is completed.
TIF district development is generally correlated with increased development and property values in area in and around the district.
- Using property value data, we analyzed the changes in property values of the parcels bordering each of our TIF districts. We did this to estimate the potential spillover effects of TIF development. These spillover effects can impact the financial and tax value of neighboring properties.
- Figure 7 shows the property value growth rate from before and after the TIF districts were created. 4 TIF districts experienced increased rates of property value growth in properties outside of but bordering the district during and after TIF development. For example, the annual growth rate of properties bordering the Ken-Mar (Wichita) TIF district increased from -1.0% to +2.6% after the district was created. The Lambertz (Salina) TIF district was the only exception, possibly because the properties around the district underwent significant development right before it was created. We were unable to evaluate this for the Melrose (Kansas City) TIF district due to a lack of property value data prior to the TIF district’s creation.
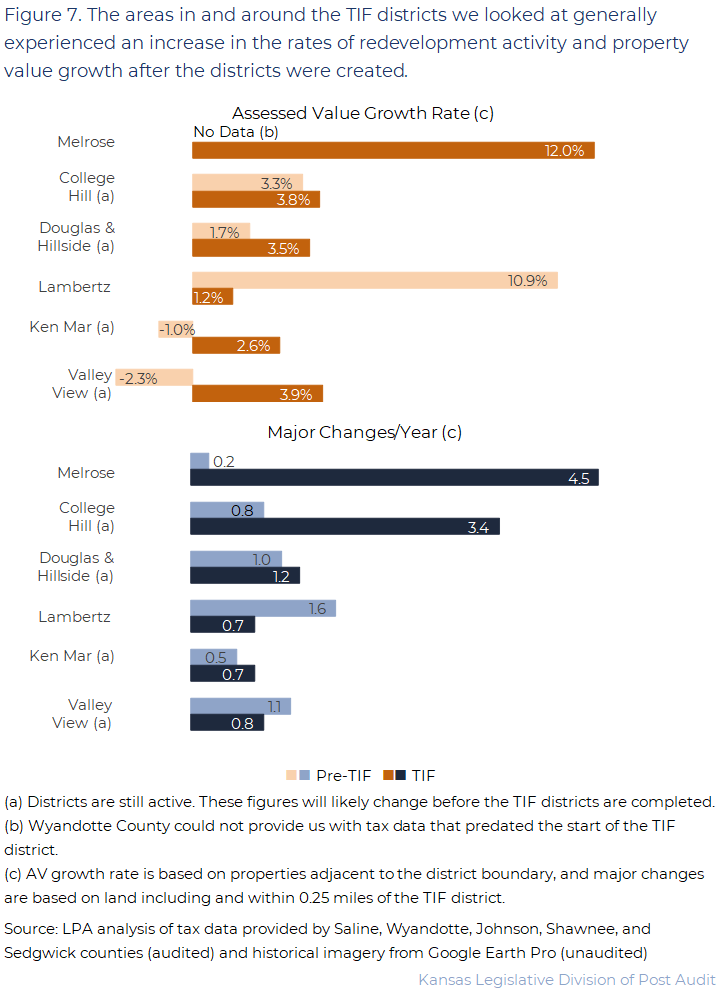
- Using historical imagery and property value data, we also analyzed the physical and structural changes of land within 0.25 miles of each TIF district we reviewed, including land within the districts. As shown in Figure 7, 4 of the 6 TIF districts experienced increased rates of major development changes (new structures, demolitions, etc.) when compared to the years prior to the district’s creation.
- For example, the area in and around the College Hill (Topeka) TIF district was experiencing about 0.8 major development changes per year on average from 1991 to 2006. From 2007 to 2023, while the TIF district was active, this rate increased to about 3.4 per year.
- However, the Lambertz (Salina) and Valley View (Overland Park) TIF districts experienced lower rates of changes while active. In the case of the Lambertz TIF district, it appears that the area around the district was experiencing significant developmental changes prior to its creation. The lower rates of change and property value growth may reflect that the pace of development eventually slowed due to high levels of existing development.
- These kinds of developmental trends in neighboring areas are correlated with and potentially linked to the development in their respective TIF districts. However, we cannot know for sure whether the TIF districts caused the additional development or property value growth in neighboring areas.
Generally, TIF districts with a commercial component brought increased job opportunities to the district.
- We used employment data from the Department of Labor to assess the change in the number of jobs within TIF districts after development. We used jobs data from the year before a TIF district was created to serve as the base. For projects that are still active, we looked at data from the most recent year (2023) to analyze the change from the base number. For TIF districts that are complete, we looked at data from the year after the project completed. For confidentiality reasons, we are unable to report the total job numbers for the districts. Businesses within the College Hill (Topeka) TIF district did not report any jobs data in 2023, and so we were unable to conduct this analysis for that district.
- 4 of the 5 TIF districts we were able to analyze experienced an increase in total jobs after the TIF development. This makes sense because these 4 TIF districts had significant commercial and retail projects. The increases in jobs were likely the result of new or relocated businesses within the districts. For example, the Valley View (Overland Park) TIF project involved the construction of a new grocery store. The total number of jobs reported in the district increased by 250% after the TIF development.
- The Douglas & Hillside (Wichita) district showed a decrease in total jobs of 80%. Prior to the establishment of the TIF district, the area included several businesses that appeared to specialize in contract work, such as a temporary employment agency. As such, these businesses reported a large number of employees that likely worked outside of the area, resulting in an inflated base number of jobs. The decline after TIF development, therefore, may be partially due to these businesses no longer operating within the district.
- We cannot be certain of our estimates because the Department of Labor’s data may have not been complete. The jobs numbers are self-reported by businesses. If a business did not report job numbers, then those jobs would not be present in the data. Further, we can’t say for certain that the increases in jobs seen in the data were the result of new jobs that did not exist before. It’s possible that the creation of new jobs in the TIF district were the result of a corresponding decrease in jobs elsewhere in the city or state.
Economic Cost-Benefit Comparison
Ultimately, whether the economic impacts of TIF are worth the financial costs depends on the type and goals of the TIF project.
- It’s difficult to use the limited amount of data available to determine how potential TIF districts’ benefits compare to their costs. The primary costs of TIF districts are direct, indirect, and opportunity costs that cities incur. Cities pay direct costs to developers and creditors, potential indirect costs from increased demand for public services, and opportunity costs from foregone tax revenue and property value growth that may have occurred without the use of TIF. TIF district benefits, however, can vary widely depending on the type of TIF district. These benefits may not always be financial in nature.
- A TIF district may result in a financial benefit from additional tax revenues to the city (and other taxing subdivisions) if it increases property values and the amount of taxes paid by property owners. A TIF district with a residential component could create additional housing opportunities in the city, and a commercially focused TIF district may create additional job opportunities. Other kinds of TIF districts may have other intangible economic benefits, such as providing additional amenities (e.g., new retail or dining options) or encouraging community involvement. It is difficult to assess how these kinds of benefits compare to the financial costs.
- We were unable to directly compare economic costs and benefits for the TIF districts we reviewed. The direct cost to cities for these districts ranged from $1.6 million to $7.0 million through the most recent year of available data. However, those costs are not complete and don’t include other costs we weren’t able to measure. Most of these TIF districts experienced higher property value growth and eventual tax revenue, as well as increased job opportunities in the area. However, higher crime rates may have public service costs that we couldn’t estimate. We cannot say whether the benefits from development represented a good return on investment.
- We spoke to city officials to further understand the potential costs and benefits of TIF districts. Officials from 3 of the cities we talked to said that one of the biggest positive impacts of a TIF district is the achievement of the project goal itself. A city may want to create a shopping center to improve the quality of life of its residents, regardless of the cost. Additionally, officials from 2 cities noted that improvements to the community are an inherent benefit. Cities and their residents may differ in how they value different kinds of TIF projects. This would likely lead to differences in how they determine whether a TIF district was ultimately a success.
The TIF districts we examined were too small to have a meaningful impact on their respective school districts.
School District Impacts
We worked with school district officials to estimate the impacts TIF districts had on school district funding and enrollment.
- We met with and gathered documentation from school district officials to determine how TIF districts can affect schools. These school districts were located at least partially within the 6 TIF districts we reviewed. This included USD 202 Turner (Kansas City), USD 259 Wichita, USD 305 Salina, USD 500 Kansas City, USD 501 Topeka, and USD 512 Overland Park.
- While a TIF district is active, some incremental tax revenue that would normally go to the school district instead goes to the city to use for their TIF costs. As a result, the school district may miss out on some amount of tax revenue for the duration of the project. In these situations, a school district may have to increase its mill levy (tax rate) to collect more tax revenue from other properties and compensate for the lost tax revenue.
- If a TIF district increases property values more than the normal rate of increase, the school district could receive more in funding after the TIF project is complete. A district may be able to lower its mill levies and still generate the same level of funding as it would have without the TIF district. To analyze these financial effects, we used historical property value data and school district mill levy rates.
- In addition to the tax revenue effects, we analyzed the potential effects TIF districts could have on school district enrollment. For TIF districts with a residential development component, we analyzed enrollment data and U.S. Census Bureau housing data. Unlike our economic impacts work, we were able to use Census data for this analysis because we only needed to analyze this data on a district-wide basis.
TIF districts can impact the amount of local tax revenue that a school district received.
- Kansas school districts are funded through a school finance formula. They receive most of their funding from the state. The amount of state funding they receive is based primarily on student enrollment. Part of this state funding comes from a mandatory 20-mill tax (0.2% tax rate) levied on all lands within a school district. The use of TIF cannot impact how much of this state funding a district receives.
- Local levies are the primary way in which school districts can be financially impacted by TIF districts. School districts are also required to adopt a local option budget for funding. Furthermore, school districts can use other mill levies to raise additional property tax revenues for a variety of purposes outlined in statute. While a TIF district is active and the base assessed valuation of its land is frozen, a school district could forego tax revenue if the land was growing in value prior to the creation of the TIF district.
- TIF districts have also affected school district levies for capital outlay costs in the past. However, due to a recent change in state law, capital outlay levies are excluded from TIF increment calculations for any TIF district established after July 1, 2017.
- We conducted a simple simulation to demonstrate how a school district’s funding can be impacted by a TIF district. We assumed the TIF district’s parcels had a combined assessed valuation of $40,000 upon creation of the district and that the district existed for 20 years. We evaluated how much revenue the school district would lose or gain from the TIF district under low and high growth scenarios:
- Without TIF development, we estimate the school district would receive $7,000 to $25,000 in total additional tax revenue over the 20-year period when the TIF district would have been active. This estimate assumes property values would have naturally increased by 3% to 8% per year. The final assessed valuation of the property would have been $70,000 to $185,000.
- With TIF development, we estimate the school district would receive $45,000 to $60,000 in additional annual tax revenue after the TIF district is complete, based on the TIF development and growth of the Melrose and Lambertz TIF districts. The final assessed valuation of the property would be between $2.0 million and $2.6 million. While the TIF district was active, however, the school district would forego about $650,000 in total revenue for the tax increment.
- This means the estimated financial gains from TIF development would exceed the estimated revenue from natural growth within the first year after development. Further, although the school district would forego some revenue for the increment while the TIF district was active, we estimate that this amount would be recouped in a little over a decade.
The TIF districts we reviewed did not have significant impacts on school district funding or enrollment.
- The freeze on the base assessed valuation of real property in a TIF district means the school district foregoes some tax revenue as the property value grows. They also forego revenue from the opportunity cost of whatever may have happened without TIF development. However, for all 6 TIF districts we reviewed, the estimated annual foregone tax revenue was less than 0.04% of each school district’s total annual expenditures. This is because the TIF districts we reviewed were too physically small (spanning only a few city blocks at most) to have a substantial impact on funding.
- For 4 TIF districts (Melrose, College Hill, Lambertz, Valley View), we estimate that, within a year of the districts’ completion, the amount of additional tax revenue school districts receive after TIF development will exceed the amount they would have received without TIF development. These 4 TIF districts have or will have contributed about $50,000 to $75,000 more in annual tax revenue to the school districts once complete. For example, we estimate the Melrose (Kansas City) TIF district has cost the USD 500 school district about $5,000 in total foregone tax revenue. Once the TIF district is complete, we estimate the school district will gain at least $75,000 in annual tax revenue from TIF development. This amount is very small relative to the school district’s overall budgets, however. USD 500 had $416.4 million in total expenditures during the 2022-2023 school year.
- Conversely, USD 259 is not expected to recoup the foregone revenue from the Ken Mar and Douglas & Hillside TIF districts for about a decade or more. This is because these 2 TIF districts have not increased property values as much as the other 4 TIF districts we reviewed. However, the TIF districts are still active, and property values may change. Further, the amount of foregone revenue for USD 259 thus far has been very small relative to their overall budget.
- The TIF districts we reviewed did not appear to have a significant impact on school district enrollment. There isn’t detailed data available that tracks where students come from and whether they moved to the school district because of TIF development. However, after analyzing overall trends in enrollment and U.S. Census Bureau housing data, we found that enrollment changes generally did not coincide with TIF development. Rather, it appears that other factors, such as the COVID-19 pandemic, had more significant impacts on enrollment counts. This is likely also because the TIF districts were too small or did not have projects that drew in large numbers of families with children.
Generally, K-12 education stakeholders told us that TIF districts do not have major impacts on schools but may still be beneficial.
- We met with school district officials to understand how they think TIF districts may affect funding, enrollment, and other aspects of the school district operations. We asked them how they view the use of TIF districts generally. We also interviewed education professionals from the Kansas Department of Education and the Kansas Association of School Boards.
- Generally, school district and K-12 education officials acknowledged that TIF districts can have financial benefits over the long term from the increase in property values and tax revenue. Most officials told us the loss of tax revenue while a TIF district is active is a detriment but is not substantial enough to have a meaningful impact. Some officials also noted that TIF districts are unlikely to increase enrollment in the short term, but they may lead to family and community growth in the long term.
- Officials from all but 1 of the 9 school districts we interviewed said they support the use of TIF districts or are neutral. Many said they believe the benefits of TIF districts outweigh the costs. Other officials explained that it is difficult to determine whether the benefits outweigh the costs with respect to schools because TIF projects and goals are often very different. A residential TIF project, for example, may be more likely to bring additional students to the district than a commercial project. Officials from one school district said they do not support the use of TIF districts in some cases because they do not believe the benefits always outweigh the costs.
Other Findings
State law does not include clear goals or data requirements for TIF districts.
- During this audit, we identified a few instances where state statutes do not provide clear requirements to local governments regarding TIF goals or data collection. These things may not be problems since TIF districts are a local tool. However, if state or local policymakers would find comprehensive data useful to help guide decision making, changes to statutes could help.
- State law does not specify any clear goals for a TIF district or project. While it states that TIF districts are intended to promote economic welfare, it does not include any specific goals like job creation. Instead, cities can specify their own goals and measures for TIF districts.
- State law also does not require cities, businesses, or other entities to collect and report data about TIF districts. As we saw with the TIF districts we reviewed, this means there is often only low-quality data or no data at all to assess certain metrics. For example, we were unable to get jobs, tax, or public service cost data from these TIF districts. Instead, we had to find similar data from other sources or do without.
- Last, statute does not authorize any oversight or tracking of TIF districts state-wide, and there is no central repository for information on TIF districts. Cities decide what information to collect for their TIF districts. That means the data among cities varies. Furthermore, it’s impossible to know how many TIF districts are in Kansas without contacting every city in the state.
Some aspects of the TIF Act may have unintended consequences.
- A change to the TIF Act in 2001 altered the timeline for tax increment collection. With the change, cities can create a TIF district and begin to collect the property tax increment without an active project. There is no deadline for the creation of a TIF project. This means that a city could collect tax increment funds from a TIF district indefinitely before beginning a development project.
- Counties and school districts are not able to evaluate a TIF project for potential veto based on the project details. Rather, they have one veto opportunity prior to the creation of the TIF district. At that point, cities are not required to have a project plan. Thus, counties and school districts may not have an opportunity to consider project details before determining whether to veto a TIF district.
- Last, we identified one instance of a city treating the calculation of the base assessed valuation differently than what’s described in state law. In this instance, the city had been calculating the base assessed valuation for individual pieces of property within the TIF district rather than for the district overall. In some situations, this allows the city to collect a larger property tax increment. This is because some individual properties may decrease in value, resulting in a lower tax increment under the normal increment calculation. However, if tax increments are calculated on a per-property basis, the city can ignore those decreases in value because it isn’t possible to collect a negative tax increment on a property. Thus, their total tax increment collection would be higher than if the negative amount had been factored into the overall total. Statute does not explicitly disallow this practice, but it appears that it may not be what was intended for the calculation of the property tax increment.
Conclusion
Tax Increment Financing (TIF) is an incentive administered entirely by local governments. The costs and benefits TIF districts generate can vary widely depending on the projects they fund, how they’re financed, and where they’re located. TIF projects may be used to create jobs or spur capital investment, or to rejuvenate an area or bring a certain type of development to an area, like a grocery store. It is difficult to calculate a benefit cost ratio or return on investment for the TIF program overall because of these varying factors. Finally, because the state is not involved, it is up to local governments who use them to establish timeframes and then determine if the TIF project is working as intended and financially sound.
Recommendations
We did not make any recommendations for this audit.
Agency Response
On August 19, 2024 we provided the draft audit report to the 5 cities and 6 school districts. Because we did not make any recommendations, their responses were optional. The City of Wichita was the only one that chose to submit a response, which is below.
City of Wichita Response
August 30, 2024
Legislative Post Audit Committee
Kansas Statehouse
300 SW 10th Street
Topeka, KS 66612
Mr. Chairman and Members of the Committee:
Thank you for the opportunity to provide perspective on the Audit Report entitled “Estimating the Economic Impacts of Tax Increment Financing Districts.” Although the report’s sample size of Tax Increment Financing Districts (TIF) was limited, it was noted in the conclusion that it is both difficult to “calculate a benefit cost ratio or a return on investment for the TIF program” and, that “…it is up to local governments that use them to establish the timeframe for measuring when to determine if the TIF project is working as intended…”
We would wholeheartedly agree with both of those conclusions.
The City of Wichita has utilized a TIF strategy over the past three decades to transform our community. Questions the City inquires of each TIF district that are used to evaluate the utility of TIF’s in Wichita include:
- Is it reducing blighted conditions and improving the well-being of a focused segment of the community;
- Is it increasing the tax base for the benefit of all taxing jurisdictions (including the City, County, School District and State of Kansas); and
- Did it require the use of City taxpayer funds?
The City’s first incremental TIF project (the Old Town TIF) transformed a blighted warehouse district near downtown Wichita into a thriving entertainment district with increasing residential development. The City’s TIF expenditures were fully recovered without the use of local taxpayer funds, and taxable property valuation was increased by an estimated $11.6 million.
The Central and Hillside TIF catalyzed the redevelopment of an area near a local medical center, with an additional $11.8 million in valuation created. In addition, the medical complex adjacent to the TIF has since invested over $370 million in improvements. No taxpayer funds were used in this TIF.
The Center City TIF in downtown Wichita was created concurrent with the development of the $190 million INTRUST Bank Arena. This TIF is ongoing, but has created $14.7 million in new valuation to date. The improvements are also aligned with the under development $300 million bio-medical campus in downtown Wichita.
hotel and other development. An additional $17.2 million has been added already to the tax base. Related to this TIF and across the Arkansas River, the West Bank TIF has spurred the development of a new $83 million multisport facility and the redevelopment of the Delano neighborhood, which features a new $33 million Advanced Learning Library constructed by the City. This TIF is also ongoing but has generated an additional $9.4 million to the tax base so far.
The audit report examined the Ken Mar TIF, a smaller TIF which was created in 2008 to revitalize the area at 13th and Oliver in Wichita. Since this TIF is currently the subject of litigation, additional comments are not appropriate at this time.
The other TIF singled out by the report is the ongoing Douglas and Hillside TIF. After initial City TIF infrastructure investments, this TIF was delayed due to limited progress by a developer that ultimately did not pay the taxes on the undeveloped part of the property for 5 years. The City Council dissolved the development agreement in March 2016 and began pursuing alternatives for the site. Ultimately, a new developer was selected by the City Council in 2016 and has successfully transformed the area to include 188 apartment units and 18,000 square feet of commercial space.
Overall, the City believes the availability of TIF financing as an economic development tool has increased the tax base, reduced blight and improved the community for residents. To date, the successful development encouraged within City TIF districts have been accomplished at no cost to local taxpayers. In addition, the City’s use of TIF’s has evolved, and current local policies include measures designed to mitigate future exposure for local taxpayers, including developer guarantees and the use of pay-as-you go reimbursement TIF’s (rather than issuing City debt). The City appreciates the Legislature’s continued support of the TIF program as a beneficial tool to improve our community and the lives of south-central Kansas residents.
Appendix A – Cited References
This appendix lists the major publications we relied on for this report.
- Competing for the Next Hundred Million Americans: The Uses and Abuses of Tax Increment Financing (Spring, 2011). George Lefcoe.
- Creation vs. Capture: Evaluating the True Costs of Tax Increment Financing (2009). Sherri Farris and John Horbas.
- Economic Development: An Economic Impact Analysis (Fall, 2010). Joseph E. De La Cerda.
- Redevelopment for Who? How TIF Redistributes Public Funds to the Wealthy (April, 2023). David Hackett.
- Some Economic Effects of Tax Increment Financing in Indiana (January, 2015). Michael J. Hicks, Dagney Faulk, and Pam Quirin.
- Tax Increment Financing: Private Investment at the Expense of Local Community (Spring, 2005). Danny Santivasci.
- Tax Increment Financing: Public Use or Private Abuse? (November, 2005). Alyson Tomme.
- The impact of tax increment financing on property value (September, 2019). Chaoran He and Seyedsoroosh Azizi.
Appendix B – Economic Estimates Detailed Methodology
This appendix includes a detailed methodology for the economic estimates we made for the selected TIF districts.
We used historical tax data to compare changes in assessed value and property taxes for each TIF district to our estimates of how they would have changed if no TIF development had occurred.
- We requested historical parcel-level data on assessed property values, property taxes, and tax levies for each TIF district from Wyandotte, Sedgwick, Shawnee, Saline, and Johnson Counties. We requested data from 10 years prior to the creation of each TIF district through 2023. To estimate what might have happened had the TIF districts not been created and the development had not occurred (no-change scenario), we looked at how the assessed values of the TIF districts changed in the years prior to their creation and projected those rates forward.
- For each TIF district, we compared our estimates for the no-change scenario to the actual assessed values and property taxes to determine how things could have differed if there was no TIF development.
- For 3 TIF districts, however, we were unable to get data for a full 10 years prior to their creation and we needed to adjust our methods.
- For Ken Mar and Douglas & Hillside, Sedgwick County was only able to provide us with assessed values back to 2004, 2 years prior to the creation of the Douglas & Hillside TIF in 2006 and 4 years before the creation of the Ken Mar TIF in 2008. We had to base our rate of change calculation on this limited data. The pre-TIF period for Ken Mar was based on a 5-year period (2004-2008) that largely corresponded with the real estate boom prior to the Great Recession. We were concerned that the rate of change from this period might be unrealistically high as a result. To adjust for this, we also projected how the value of the TIF parcels would have grown if they grew at a similar rate as the properties adjacent to the TIF while it was active. In this report, we present these results as a range for the Ken Mar TIF district.
- For the Melrose TIF district, Kansas City was unable to provide any historical data prior to the creation of the TIF district due to a limitation with their data system. To estimate what might have happened in the no-change scenario, we instead selected a sample of 10 vacant parcels in Kansas City, Kansas that occupied similar types of locations as the Melrose TIF district (i.e., between residential areas and major highways) and that did not appear to have been developed during the years the district was active. We determined this by comparing 2001 Wyandotte County aerial imagery to 2022 aerial imagery that was available on their online Geographic Information System (GIS) portal. We looked at how the assessed values for this sample of properties changed during the years the Melrose TIF district was active and used that rate of change to estimate the no-change scenario for the district.
- All 6 TIF districts we looked at included some amount of commercial, industrial, or retail development. This development likely had some effect on sales tax revenues in addition to property tax revenues. However, we couldn’t estimate the magnitude of that effect because we did not have sales tax revenue data.
Using data from city police departments, we analyzed how crime rates from before the TIF districts were created compared to crimes rates while they were active.
- We requested crime report data for the 6 TIF districts from the Topeka, Kansas City, Overland Park, Salina, and Wichita police departments. We requested data from 10 years prior to the creation of each TIF district through 2023 or the last year they were still active. For all 6 TIF districts, we were unable to get data for a full 10 years prior to their creation.
- The Overland Park police department was able to get us data back to 2002 (8 years prior to the creation of the Valley View TIF district).
- The Wichita police department was able to get us data back to 2001 (5 years prior to the creation of the Douglas & Hillside TIF district and 7 years prior to the creation of the Ken Mar TIF district).
- The Topeka police department was able to get us data back to 2003 (3 years prior to the creation of the College Hill TIF district).
- The Lambertz TIF district was a vacant field prior to development and had no associated addresses to query for crimes.
- The Kansas City police department was unable to provide any crime data for the Melrose TIF district due to a system outage that occurred earlier in 2024. This outage restricted their access to their records management system.
- We calculated summary statistics and average annual crime rates for the pre-TIF and TIF periods. To better compare the data across TIF districts, we chose to categorize the crimes into people, property, and society crimes.
- Some police departments also included data for non-criminal incidents such as traffic accidents or wellness checks. These incidents were excluded because we only considered crimes in our analysis. When possible, we referenced National Incident-Based Reporting System codes to help us identify and remove non-crime incidents.
We analyzed Kansas Department of Labor unemployment insurance data to determine how the number of jobs changed in each of the 6 TIF districts before and after the districts were created.
- We used confidential enhanced quarterly unemployment insurance (EQUI) data provided by the Kansas Department of Labor (KDOL) to analyze job numbers. This data included self-reported job numbers from Kansas employers. To avoid the dramatic fluctuations in employment that can occur during and immediately after the holiday season (Quarters 1 and 4), we used report data from quarter 2 for the year prior to each TIF district’s creation and from the final year they were active (or 2023 if the TIF district was still active).
- We were limited in our ability to get an accurate count of jobs due to limitations in the KDOL data. For the analysis, we used physical locations to count jobs associated with the addresses within the TIF districts. We found that some amount of jobs data appeared to be missing in the TIF district we looked at, however. This is because employers are not required to submit this information to KDOL, and some employers choose not to.
- For example, we were unable to do a jobs analysis for the College Hill TIF district because there were no 2023 jobs reported for any addresses in the district. That was despite at least 4 of the addresses appearing to be associated with businesses.
We used historical tax data from counties and imagery from Google Earth Pro to determine how the rate of change in development and assessed values of properties neighboring the TIF district changed before and after the districts were created.
- Like the trend analysis above, we requested parcel-level data from counties for assessed property values for the properties that shared a border with the 6 TIF districts. We requested data from 10 years prior to the creation of each TIF district through 2023 or the final year they were active. We calculated an average annual rate of change for the properties neighboring each TIF district for the period before the TIF district was created and the period when it was active.
- We were unable to get a full 10 years of pre-TIF data for 2 TIF districts, and we were only able to do this analysis for 5 of the 6 TIF districts. We calculated a pre-TIF rate of change with the data we could get. Because this data was limited, however, the rate of change from the pre-TIF periods may have been different if we had received more years of data.
- Sedgwick County was only able to provide us with data back to 2004.
- We were only able to get reliable data from Overland Park back to 2006.
- Kansas City was unable to provide any pre-TIF data.
- We also compared Google Earth Pro imagery from multiple years to look for major changes to the area’s structures (e.g., demolitions, expansions, new constructions, replacements). These changes could indicate that there was redevelopment occurring within the area. We were limited in the imagery we could get from the software program, but we tried to get imagery from 10 years prior to the each TIF district’s creation, the year prior to its creation, and the year after it was completed or 2023 if it was still active. We focused on an area in and within a 0.25-mile radius of each TIF district. All the imagery was downloaded from Google Earth Pro and georeferenced, digitized, and analyzed in ESRI’s Arc Pro Geographic Information System (GIS).