Evaluating the STAR Bonds Financing Program
Introduction
This audit satisfies requirements of K.S.A. 46-1137 that were in effect on December 12, 2022. The Legislative Post Audit Committee directed us to evaluate this economic development incentive program at that meeting.
Objectives, Scope, & Methodology
State law (K.S.A. 46-1137) requires us to include 3 components in our evaluations of the state’s economic development incentives: a description of the incentive, a literature review, and an estimate of the incentive’s economic and fiscal impact.
The following audit objective evaluates the STAR bonds financing program’s economic and fiscal impact:
- Do STAR bond districts increase local quality-of-life amenities, and what effect do those amenities have on college graduates in Kansas?
To answer this question, we talked to officials and reviewed information from the Departments of Commerce and Labor and a selection of 5 cities. The cities included Derby, Dodge City, Overland Park, Salina, and Wichita. The information we reviewed included details about all STAR bond districts and projects. It also included the businesses and employment located in and near 6 districts in these 5 cities. We used this information to determine how certain industries’ employment changed in and near these districts.
We also worked with the 6 Kansas Board of Regents universities to survey undergraduate and graduate students graduating in May 2024. Similarly, we worked with the Pittsburg State University and University of Kansas alumni associations to survey these universities’ alumni. We asked survey recipients about the things that affect their location decisions and quality of life.
More specific details about the scope of our work and the methods we used are included throughout the report and in Appendix B as appropriate.
Important Disclosures
We conducted this performance audit in accordance with generally accepted government auditing standards. Those standards require that we plan and perform the audit to obtain sufficient, appropriate evidence to provide a reasonable basis for our findings and conclusions based on our audit objectives. Overall, we believe the evidence obtained provides a reasonable basis for our findings and conclusions based on those audit objectives.
Our audit reports and podcasts are available on our website (www.kslpa.gov).
The 6 STAR bond districts we reviewed grew in quality-of-life industries survey respondents said they value, but the numbers and types of industries varied by district.
Background
The STAR bonds program allows local governments to use future sales tax revenue for development or redevelopment projects.
- The Legislature first authorized the use of sales tax and revenue (STAR) bonds in 1993. In 1997 and 1998, it amended state law to let Wyandotte County use STAR bonds to finance the Kansas Speedway and Village West, respectively. As Figure 1 shows, 13 cities have created 17 districts in the years since. The program sunsets in July 2026.
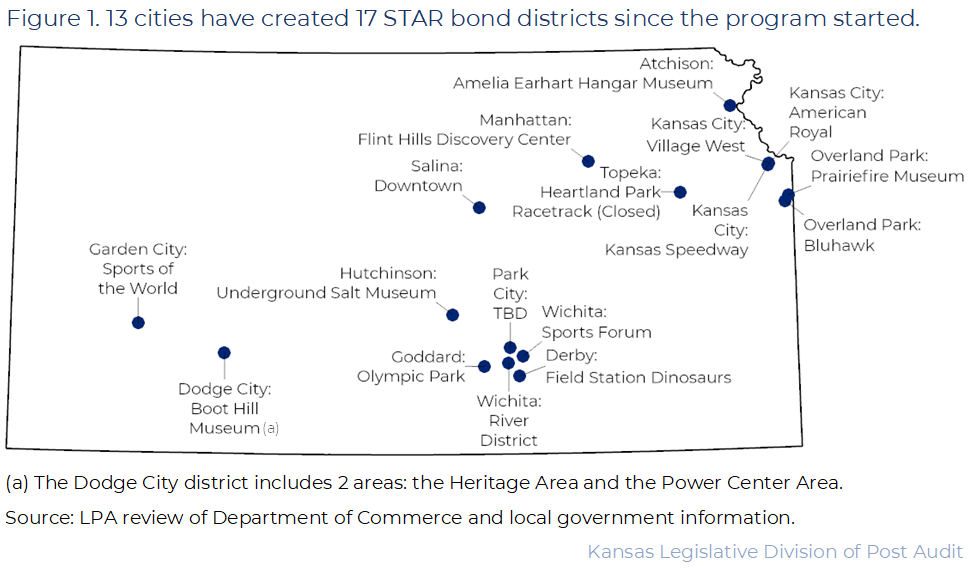
- STAR bonds are an economic development tool. They allow local governments to issue bonds to help finance tourist attractions in development districts they create. These districts can include either new or existing businesses. Metro areas under 50,000 may have non-contiguous districts, and certain districts (e.g., Atchison, Dodge City, Hutchinson) include different parts of town.
- STAR bonds can help pay for project costs like property acquisition, site preparation, and infrastructure improvement. The Department of Revenue uses part of the state and local sales tax revenue generated from the businesses in the district to repay the bonds.
- The creation of a STAR bond district is a collaborative effort between state and local government. It uses both state and local sales tax revenue to repay the bonds. This only includes incremental sales tax revenue, so the preexisting revenue amount from before the district’s creation (e.g., from existing businesses) still goes to the state and local governments.
- State law generally requires local governments to retire STAR bonds in 20 years. For the Kansas Speedway, this was 30 years. After that time, the attraction should be self-sufficient financially, and the full amount of sales taxes from the district starts going to the state and local governments.
- The Secretary of Commerce is responsible for approving STAR bond projects and districts. The Legislature added this requirement in 2003.
The Legislature made several changes to the program since our 2021 audit.
- We last evaluated the STAR bonds financing program in 2021. At that time, we measured the program’s tourism impact. We found that only 3 of the 16 STAR bond attractions we reviewed met Commerce’s tourism-related goals in 2018 and 2019. These goals are to draw 20% of visitors from outside Kansas and 30% of visitors from at least 100 miles away. The Hutchinson Underground Salt Museum, Topeka Heartland Park, and Kansas Speedway met both goals in 1 or both years we reviewed.
- The Legislature passed laws changing the program in 2021. These changes include 2 new eligible project types, 1 of which also allows for a new financing method. The 2 new project types are:
- Major business facilities: either business headquarters or office buildings that are expected to draw a significant number of visitors to Kansas.
- Rural redevelopment projects: projects located outside metropolitan areas that are expected to enhance local quality of life. Unlike other project types, they don’t require bonds. Instead, up to $10 million in project costs could be reimbursed using incremental sales tax revenues. These are the funds that otherwise would’ve gone toward bond repayment. 2023 Senate Bill 28 raised this limit to $25 million for fiscal year 2025.
- 2023 Senate Bill 28 also authorized using STAR bonds to finance a major amusement park. It required that at least $100 million in capital improvements be made for the park’s construction. The provision only applied to fiscal years 2025 and 2026.
- Finally, 2024 House Bill 2001 authorized using STAR bonds to finance stadiums for up to 2 professional sports teams. The teams must come from a state adjacent to Kansas. The projects must total at least $1 billion in capital investment, up to 70% of which can be financed with bonds. This provision expires June 30, 2025.
Commerce officials expect STAR bond districts to improve local quality of life, but they haven’t defined or measured this.
- We found during our 2021 audit that state law broadly defined the program’s purpose as the stimulation of the general and economic welfare of the state. We evaluated STAR bonds’ tourism impact at that time because state law, legislative testimony, and Commerce program guidance suggest it’s the program’s main purpose. It’s also what sets the program apart from other economic development programs.
- Commerce officials said that although tourism matters, improving local quality of life is also an important program goal. They said they consider this when determining whether to approve a proposed STAR bond project.
- Commerce officials told us they want districts to improve their local areas’ quality of life and encourage people to live in Kansas. They said they care about all demographic groups but focus especially on attracting younger, college-educated adults because they’re important for the state’s economic future. However, Commerce officials haven’t defined what “quality of life” means or how to measure it.
- State law also doesn’t define “quality of life” or how it should be measured. State law only mentions the program should stimulate the general and economic welfare of the state.
- We based our current audit approach on Commerce officials’ stated quality-of-life goal. Since they hadn’t defined this, we based our methods on widely used economic analysis methods and relevant literature. We can’t say whether the results of our work show the program is successful because neither state law nor Commerce has established relevant benchmarks.
To evaluate the program’s effects, we first determined how 6 districts changed over time in 109 quality-of-life industries.
- We combined an economic analysis and a survey to answer the audit question. Putting these 2 pieces of work together allowed us to determine whether STAR bond districts were changing in ways that aligned with what college graduates said affected their quality of life. Appendix B more fully explains our methodology.
- First, we determined how a selection of quality-of-life industries changed over time in a selection of 6 districts.
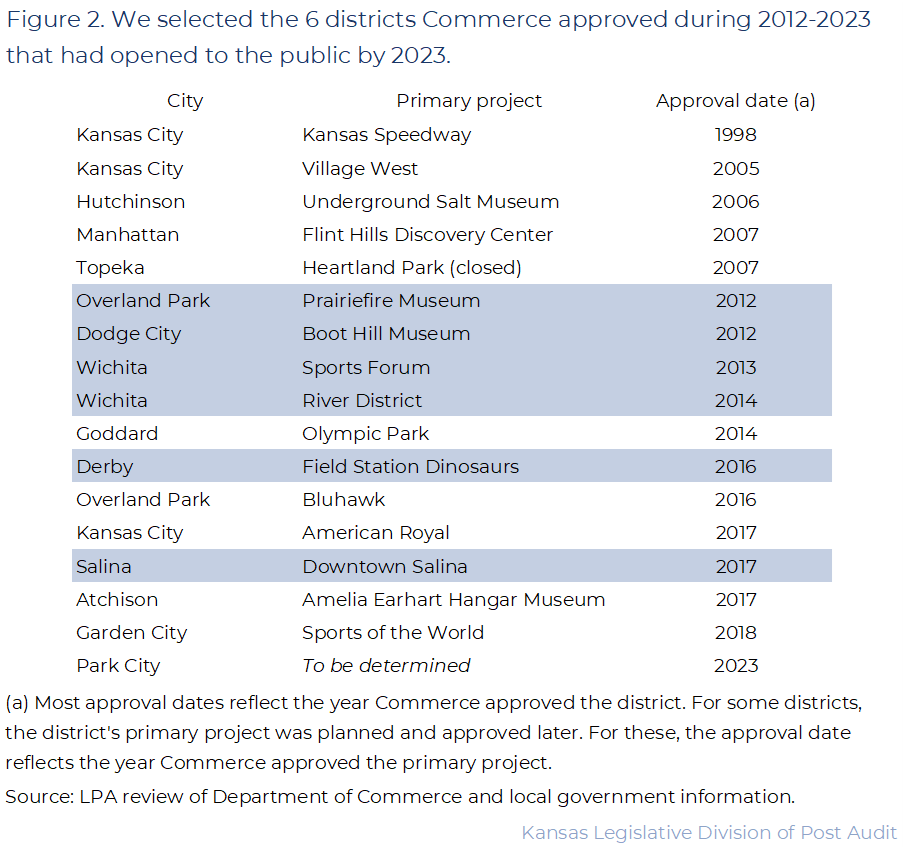
- Figure 2 shows the years Commerce approved each STAR bond district or project statewide. As the figure shows, Commerce approved 6 districts or projects in Derby, Dodge City, Overland Park, Salina, and Wichita during 2012-2023. These were the only ones approved during this period that were open to the public by 2023. We selected projects that were open to the public to ensure our analysis captured the effects of complete, mature projects.
- Reviewing the years 2012-2023 was important because these years had the most complete and consistent employment data available from the Department of Labor. The data needed for our analysis was not available or was inconsistent for projects older than 2012. This was primarily because of federal changes to national industry classifications.
- The districts we selected also varied in their locations and attraction types. Our results shouldn’t be projected beyond them because each district is unique.
- We used Department of Labor data to determine how industries’ employment density changed in these 6 districts. We compared the year Commerce approved each district to 2023.
- An industry’s employment density measures how many of the total jobs in an area are in each industry. For instance, the museum industry’s density compares the number of museum jobs to the number of jobs overall. Analyzing industry density (formally known as a location quotient) is a widely used method in economics for studying industry changes.
- We compared industry densities in the 6 districts to the industry densities in the 2-mile areas around the districts to see how the districts compared to their surroundings. We refer to this 2-mile area around and including the district as the local area. We also compared industry densities in the local areas to the state. This showed whether each industry played a proportionally larger role in the local economy than in the state economy. If not, the industry made up an equal or smaller share of local employment than it did statewide.
- We calculated these densities for 109 industries we thought might contribute to people’s quality of life. We selected these industries based on relevant literature and our professional judgement. The literature included things like studies of college graduates’ migration patterns and a national survey conducted by The Pew Charitable Trusts. Figures appearing later in the report list these industries, which include things like theaters, museums, stores, and restaurants.
We then compared the 6 districts’ industry changes in these 109 quality-of-life industries to what college graduates told us affected their quality of life.
- We surveyed graduating students and alumni of Kansas universities to find out what factors affect where they choose to live and how they perceive their quality of life. The students included both undergraduate and graduate students. These were the groups Commerce said they particularly wanted the program to help attract to Kansas. Neither group’s responses should be projected to these populations.
- First, we surveyed students set to graduate from the 6 Kansas Board of Regents Universities in May 2024. These include Emporia State University, Fort Hays State University, Kansas State University, Pittsburg State University, the University of Kansas, and Wichita State University. We didn’t have time or resources to include other colleges and universities. We sent 12,604 surveys and received 786 responses, for a 6.2% response rate.
- Second, we contacted alumni associations to survey alumni from as many of these same 6 universities as we could. Only the Pittsburg State University and University of Kansas alumni associations agreed to facilitate the survey. We included all alumni for whom the associations had valid emails, including alumni who left Kansas. We sent 150,282 surveys and received 3,283 responses, for a 2.2% response rate.
- We based our survey questions on relevant literature. This literature showed people usually don’t move far from their birth state due to things like family ties and feelings of belonging. For example, a study conducted by Harvard University and the U.S. Census Bureau found that at age 26, 69% of people still lived in the area where they grew up and 80% lived within 100 miles. Further, the top responses to a national Pew survey asking adults why they hadn’t moved were things like “family ties,” “grew up here,” “good place to raise children,” and “belong here.”
- But the studies we reviewed also showed those who do move are more likely to be college-educated. They’re also more likely to be influenced by factors like job prospects or amenities. For example, studies from Stanford University and the National Bureau of Economic Research showed college graduates were attracted to cities with higher wages and better amenities, such as more retail stores and restaurants and less pollution and traffic.
The STAR Bonds Program’s Quality-of-Life Effects
Survey respondents said social and economic factors other than amenities have more influence on where they want to live.
- We asked both student and alumni survey respondents whether they were planning to leave or stay in Kansas (or had already) and what factors were important to those decisions. One possible factor was the availability of amenities. Among other things, amenities include the kinds of businesses that fall into the 109 quality-of-life industries we identified.
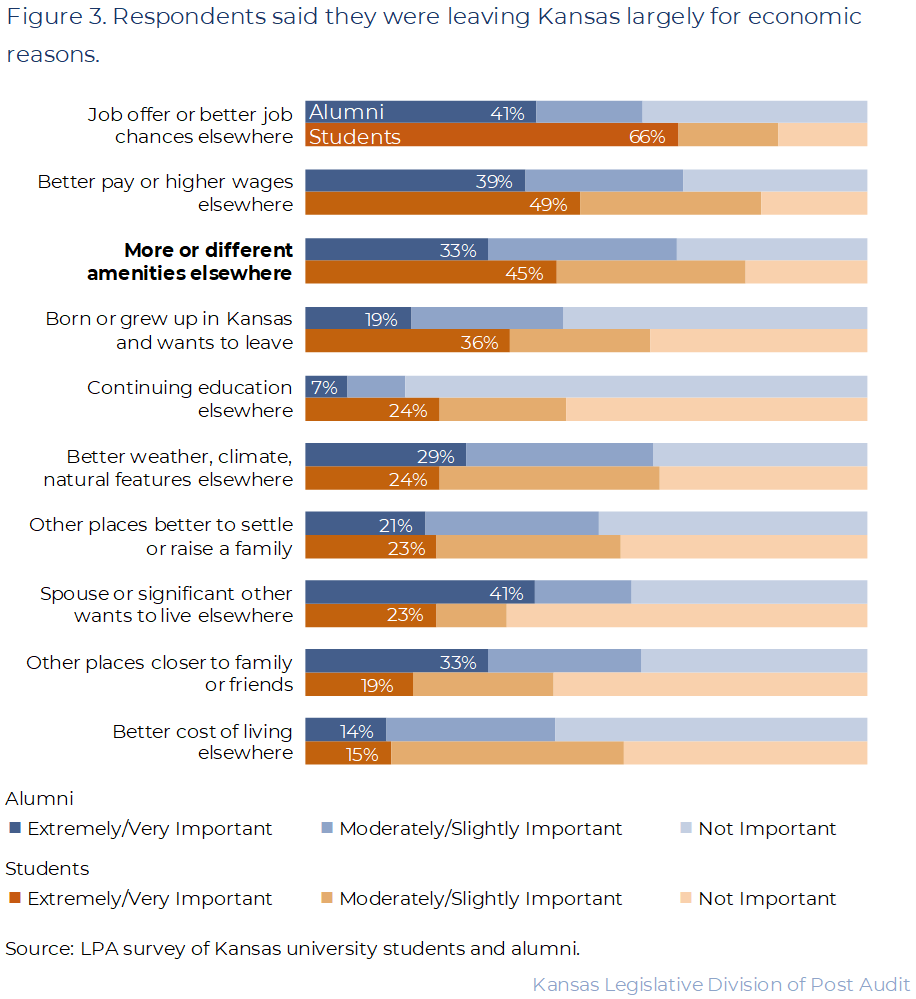
- Survey respondents said they generally made location decisions for reasons other than amenity availability. These opinions shouldn’t be projected beyond the survey respondents.
- Figure 3 shows the responses of students and alumni leaving Kansas. As the figure shows, having a job or job offer outside Kansas or feeling like one can get higher pay outside Kansas were among both groups’ top 3 responses. This generally aligns with the literature we reviewed.
- Figure 4 shows the responses of students and alumni staying in Kansas. These respondents had different priorities than those leaving the state. Both students and alumni had the same top 3 responses, but in different orders. Both groups feel like Kansas is a good place to settle down, they want to be near friends or family, and they value Kansas’s low cost of living. Again, these responses generally align with the literature we reviewed.

However, about half of respondents or more said amenities in all 10 industry groups we asked them about were important to their quality of life.
- We also asked students and alumni which types of amenities were important to their quality of life. We asked about amenities related to 10 overarching industry groups that include all 109 quality-of-life industries we identified. The 10 industry groups range from pharmacies and restaurants to grocery stores and museums.
- Amenities in all 10 groups were important to about half or more of survey respondents’ quality of life. Grocery and food stores and supercenters were most important, with 95% of students and 93% of alumni responding that they are important to their quality of life. Conversely, breweries, liquor and tobacco stores, and bars were last, with just 49% of students and 52% of alumni identifying them as important.
- The survey responses provide important context for evaluating the types of industry growth occurring in the STAR bond districts we reviewed. In the following sections of this report, we look at the types of industries each district added and how they align with the 10 industry groups and 109 industries that respondents said were important to them.
All 6 districts we reviewed added jobs in quality-of-life industries from the time the district was approved to 2023.
- Figure 5 shows how many new jobs were added in each district, as well as what percentage of these jobs were in the 109 quality-of-life industries we reviewed. As the figure shows, all 6 districts added jobs in quality-of-life industries during the years we reviewed.

- For 5 districts, most of the jobs were in quality-of-life industries. For example, Overland Park’s district grew in industries like museums, movie theaters, and clothing stores. Only the Wichita River District added jobs primarily in other industries, such as freight transportation and warehousing. This may be due to its downtown location, which includes office buildings.
- The Derby, Overland Park, and Wichita Sports Forum districts were largely undeveloped land when Commerce approved them. This gave them more room for rapid growth. This likely helps explain how they gained so many more new jobs than the Dodge City or Salina districts.
- Finally, the 6 districts generally grew much faster than their local areas, their cities, and the state in both quality-of-life industries and all other industries. This matters because it shows whether the district is growing at the same rate as its surroundings. If so, it might simply be following broader state or local growth patterns unrelated to the STAR bonds program.
- For instance, Derby’s district grew by 54% in all industries from 2016-2023, whereas its local area grew by 22%, the city by 19%, and the state by 4%. The district’s rapid growth suggests it wasn’t simply following Derby’s wider growth patterns due to things like population growth. Further, the Dodge City and Salina districts grew while their local areas lost jobs.
- In addition, the Derby district grew by 29% in the 109 quality-of-life industries from 2016-2023, whereas the local area grew by 17%, the city by 14%, and the state by just 1%. Again, this suggests something other than citywide growth patterns contributed to the concentration of certain industries in the district. Only the Wichita River District grew less than its local area in the quality-of-life industries we reviewed.
- As outlined below, though, this growth didn’t always align well with what survey respondents said was most important.
The 6 districts grew most often in industries that most survey respondents (81%-85%) said were important to their quality of life.
- Figure 6 shows which industries related to personal care and clothes stores grew in the 6 districts we reviewed.
- The industries shaded in the figure are the industries that had significant job density growth in the district. This means the district’s growth had a measurable impact on its local area, too. For example, if the museum industry grew significantly in a district we reviewed, this means its job density outperformed and impacted the density of the museum industry in its local area, too. This matters because it means the industry’s growth may have had a bigger impact on people’s quality of life.
- Those that aren’t shaded didn’t have significant density growth between when Commerce approved the district and 2023. The district may have no jobs in some of these industries, whereas in others the density may have gone down or stayed the same.
- The figure also shows which growing industries were new to the local area and which ones preexisted the districts. Further, it shows whether preexisting industries started with at least the same job density as the state. These distinctions are important, but we don’t discuss them in detail until later in the report.

- The 6 districts we reviewed grew in more industries within the personal care and clothes stores groups than any of the other industry groups. As the figure shows, half of the industries in these groups grew in at least 1 district. For example, beauty salons grew in 4 of the 6 districts. And gift, novelty, and souvenir retailers grew in 3 districts.
- It’s important to note that significant industry growth may look different in different districts. For instance, the cosmetics, beauty supplies, and perfume retailers industry grew significantly in both the Salina and Wichita Sports Forum districts. But this industry added 26 jobs in Wichita’s district and just 3 jobs in Salina’s district.
- As the figure also shows, 81%-85% of survey respondents said these industry groups were important to their quality of life. As such, widespread growth in these industries likely improves people’s quality of life.
The 6 districts grew similarly in industries that only about half of respondents said were important.
- Figure 7 shows how the industries related to breweries and liquor stores grew in the 6 districts we reviewed. As the figure shows, more than half of the industries in this group grew in at least 1 district. For example, drinking places grew in 3 of the 6 districts. And 5 districts grew in at least 1 of the industries in this group.

- The growing industries in this group didn’t reflect the districts’ main bond-funded attractions. For instance, Dodge City’s main projects were the renovation of an existing museum and the city’s historic downtown. But as the figure shows, this district also attracted a distillery. The distilleries industry was new to the area.
- As the figure also shows, just 49%-52% of survey respondents said this industry group was important to their quality of life. As such, widespread growth in this industry may have less impact on people’s quality of life.
However, the 6 districts grew in few of the industries that the largest percentages of survey respondents (86%+) said were important.
- Figure 8 shows how the industries related to grocery stores, restaurants, sports, and performing arts grew in the 6 districts. As the figure shows, the districts we reviewed grew in only a handful of the industries within these industry groups. Fewer than half of the industries in these groups grew in at least 1 district. For example, both museums and snack bars grew in 2 of the 6 districts.

- Several of the growing industries in these groups reflect the districts’ main attractions. For instance, the Salina and Overland Park districts’ project plans included bond funding for museums. And the Derby district’s plan included bond funding for an amusement arcade.
- As the figure also shows, these groups were the most popular among survey respondents. 86%-95% of respondents said they were important to their quality of life. As such, less common growth in these industries may represent missed opportunities to impact people’s quality of life. For example, only the Overland Park district increased the density of the full-service restaurant industry. And none of the districts increased the density of things like grills and buffets or mobile food services (e.g., food trucks).
Finally, the 6 districts grew very little in a few industries that most respondents (68%-80%) said were important.
- Figure 9 shows how the industries in the remaining 3 industry groups grew in the 6 districts. These include the groups related to traveler services, home improvement stores, and transportation services. As the figure shows, only 4 total industries from these groups grew.

- Overall, nearly every industry group we reviewed grew in at least 1 industry. The transportation services group was the only 1 of the 10 we reviewed that experienced no job density growth in any of the 6 districts.
- Only the hotels and motels industry grew in at least half of the 6 districts, although in 2 cases it started at the statewide density level. All 3 of these districts included hotels in their project plans, even if this industry didn’t directly receive bond funding.
- As the figure also shows, these industry groups were less popular than many others. 68%-80% of respondents said they were important to their quality of life. As such, the minimal growth in these industries likely matters less to people’s quality of life than similar growth in the more popular industries noted above.
Survey respondents said all 6 districts’ primary attractions were at least slightly important to their quality of life.
- We also asked survey respondents whether they had visited the main attractions in each STAR bond district. We limited this to the 17 attractions that were open to the public by 2023. If they had visited, we asked whether these attractions were important to their quality of life. 669 students and 2,721 alumni answered this question. We didn’t ask about each business in each district because that would’ve been too many for respondents to consider.
- Figure 10 shows how many respondents who visited the primary attractions in the 6 districts said they were at least slightly important to them. As the figure shows, each attraction was important to at least half of respondents from 1 or both groups. For example, about two-thirds of students and three-quarters of alumni said the Prairiefire Museum and shopping area in Overland Park was at least slightly important to them.

- Survey respondents said similar things about the other 10 attractions we asked about. At least half of student respondents who had visited them said 8 of the 10 were at least slightly important to their quality of life. And all 10 were at least slightly important to half or more of alumni who had visited them.
The 6 districts varied widely in the numbers and types of industries with job density growth.
- As Figures 6-9 show, the 6 districts grew in different numbers or types of quality-of-life industries.
- For instance, the Wichita Sports Forum district had job density growth in 20 quality-of-life industries across 8 industry groups. By contrast, the Wichita River District grew in just 5 industries across 5 industry groups.
- Further, districts grew in the beauty salon, nail salon, gift retailer, drinking places, and hotel and motel industries more than any other industries. However, only 1 or 2 districts increased in industries related to clothing and furniture retailers, museums, arcades, or fitness centers.
- The figures above show that the industries with job density growth were generally new to the area or had few local jobs compared to the state. Only the Overland Park district mostly grew in industries that were already locally as dense as the state. For instance, the full-service restaurant industry grew in the Overland Park district, but its local area already had state-level job density in this industry. This matters because growth in industries that are new or were less common locally likely has a bigger impact on people’s quality of life. Growth in industries that were already commonly available in the local area may impact people’s lives less.
- Finally, STAR bonds’ repayment mechanism likely affected which industries grew in the 6 districts. STAR bonds must generally be repaid using sales tax revenues. For this reason, Commerce officials said they ensure project plans include sales-tax-generating industries. The 109 quality-of-life industries we reviewed typically generate sales taxes.
We don’t know for sure how the STAR bonds program affected the 6 districts, but the infrastructure it financed likely contributed to the patterns we observed.
- Overall, we don’t know for sure what role the STAR bonds program played in the 6 districts’ development. Lots of factors play a role in such developments. These include things like natural demand from residential growth or funding from other incentive programs. It’s possible these districts might have developed similarly without STAR bonds. And we don’t know how these 6 districts’ experiences might compare to the rest of the STAR bond districts.
- City officials said 5 of the 6 districts got incentives in addition to STAR bonds. Only Derby officials said their district received no other incentives. In most cases, these were community improvement districts (CIDs). This makes it difficult to isolate the STAR bonds program’s effects. For instance, the Wichita Sports Forum district also received CID funding to help finance the district’s full K-96 highway interchange. We don’t know which program caused the interchange’s construction, which city officials said was critical to the district’s development.
- The STAR bonds program’s biggest impact on the 6 districts’ growth likely was financing their infrastructure and aesthetic improvements. This aligns with state law, which mostly restricts bond proceeds to ancillary project costs like these. For example, state law prohibits bond proceeds from being used to construct businesses’ buildings, except for certain main attractions.
- For instance, 12 industries grew significantly in Overland Park’s district. STAR bonds financed the Prairiefire Museum, which contributed to growth in the museum industry. Growth in the other 11 industries came from businesses like clothes and sporting goods stores and a movie theater. These businesses didn’t directly receive bond proceeds, but they likely benefitted from things like the parking garage and landscaping that did.
- City officials from 4 of the 6 districts said the districts likely would’ve developed even without using STAR bonds. This seems clearest for districts built on undeveloped land, such as the Derby, Overland Park, or Wichita Sports Forum districts. These areas likely would’ve developed in some way as the cities grew toward them. But officials thought STAR bonds made an important difference, and the development would’ve happened later or looked different without STAR bonds. For instance, Overland Park officials said the Prairiefire district area likely would’ve developed anyway, but without the museum or parking garage that received bond funding.
Other Findings
We recommended in 2021 that Commerce measure the STAR bonds program’s tourism impact.
- We measured the program’s tourism impact during our 2021 audit. We found that only 3 of the 16 STAR bond attractions we reviewed met Commerce’s tourism-related goals in 2018 and 2019. However, we also found that Commerce did not have a way to measure those goals.
- We recommended in 2021 that Commerce begin collecting STAR bond attractions’ visitation data. We recommended they use it to evaluate whether current attractions meet the agency’s goals and use this to inform decisions about proposed attractions. For instance, only proposals including attraction types proven to meet Commerce’s goals should be approved.
- The Legislature also changed state law in 2021. It required that Commerce-approved consultants conduct proposed attractions’ feasibility studies. They must include a plan for tracking and reporting visitors’ ZIP codes.
- Commerce officials said they don’t interpret the 2021 change to require all previously approved STAR bond district businesses to report visitation data. They said only businesses approved after the 2021 change to state law are required to do this. They don’t have the ability to require attractions approved before 2021 to provide visitation data.
Commerce officials said they plan to implement our 2021 recommendation.
- During this audit, we followed up on our 2021 recommendation. Commerce officials told us they planned to implement this recommendation. They said the agency’s Tourism division had smartphone data that would let them see where STAR bond district visitors came from. This is similar to the data we used for our 2021 audit.
- Commerce officials said they will use this data for a few purposes, including one that aligns with our 2021 recommendation.
- Commerce officials said they’d use the Tourism division’s data to review current attractions’ visitation. If a proposed attraction is similar to a current one, they said they’d review the current attraction’s success when evaluating the proposed attraction.
- Officials also said they’d help attractions meet their visitation goals when the visitation data show an attraction isn’t doing so. For instance, officials said they might encourage a sports facility to bring in more out-of-state teams to tournaments. For attractions already meeting the goals, officials said they’d help the attraction continue doing so. This might include marketing in the out-of-state places where visitors already come from.
- Finally, officials told us they’d use the data to validate the accuracy of approved attractions’ visitation projections. These are part of districts’ feasibility studies. Since 2021, state law has required Commerce to approve the consultant making the projection. Officials said they would try to improve these projections if the data show they weren’t accurate.
- The plan Commerce officials described would go beyond the statutory requirement added in 2021. It would give them greater insight into how well the program is working, which types of attractions contribute to its success, and which types of attractions should be approved going forward.
Only Kansas and 2 other states have STAR bonds programs, and virtually no literature about them exists.
- Kansas created the country’s first STAR bonds financing program. Illinois and Nevada also have programs, seemingly modeled on Kansas’s. Illinois approved its first STAR bond project in the years since we conducted our 2021 evaluation. Nevada hasn’t used its program since our last evaluation.
- State law requires that we conduct a literature review as part of our evaluation. However, little literature on these programs exists, likely because they’re so uncommon.
- Consequently, we didn’t find enough studies to draw any conclusions about the program’s effectiveness.
Conclusion
Our prior audit of STAR bonds focused on the tourism aspect of the program as referenced in statute. Commerce officials told us although tourism matters, improving local quality of life is an important program goal. Improving amenities may encourage people to move or stay in Kansas. Based on this audit, it appears some STAR bond districts may help to spur growth in some industries related to local amenities. Each of the 6 districts we reviewed increased job density in at least a handful of industries that college graduates said were important to their quality of life. However, graduates that responded to our surveys indicated social and economic factors other than amenities were most important to them when deciding where to live. For example, job prospects and proximity to family were rated as more important factors in influencing whether they stayed in or left Kansas. Because statute does not provide clear benchmarks for measuring program success, it is up to legislators to decide how the program’s quality-of-life outcomes compare to its tourism outcomes.
Recommendations
- The Department of Commerce should define its quality-of-life goals for STAR bond districts and measure whether districts meet these goals.
- Agency Response: Commerce will look for new ways to improve and fine-tune the STAR Bonds, including better defining the quality of life for evaluation processes, to make STAR Bonds an even more effective tool for growing the state and its communities.
Agency Response
On August 23, 2024 we provided the draft audit report to the Department of Commerce and the cities of Derby, Dodge City, Overland Park, Salina, and Wichita. The Department of Commerce’s response is below. Agency officials generally agreed with our findings and conclusions. City officials chose not to respond to the audit.
Department of Commerce Response
The Department of Commerce (Commerce) has reviewed the Performance Audit Report titled, “Evaluating the STAR Bonds Financing Program.” The audit objective was to evaluate if the STAR Bonds program increases the local quality of life amenities and what effect those amenities have on college graduates in Kansas. In general, we agree with the statements in the report written by the Legislative Post Audit team. The data analysis, city official interviews, and alumni and student survey results indicated that the STAR Bond districts grew quality-of-life industries in their respective cities. The quality-of-life industries were identified through the LPA surveys. All six districts evaluated added jobs in the quality-of-life industries during the reviewed years. Furthermore, the districts grew most often in industries that most survey respondents said were important to their quality of life.
The evaluation highlighted that the STAR Bond program helps grow industries like museums, movie theaters, and clothing stores. The Derby, Overland Park, and Wichita Sports Forum districts were largely undeveloped land when the agency approved the STAR Bond project. In these districts, the evaluation found rapid growth. Overall, all six districts grew much faster than their local areas, their cities, and the state in quality-of-life industries and all other industries.
K.S.A. 12-17,160 states that the purpose of this act is “to promote, stimulate, and develop the general and economic welfare of the State of Kansas, including Kansas communities.” The growth the audit found in these six STAR Bond districts clearly demonstrates that the program meets the intent of the legislation and the program’s goals. It is important to note that some areas included in STAR Bond districts may have developed anyway, as stated by city officials during their interviews. However, the development density, the speed at which the development occurred, and the type of industries in the districts directly resulted from the STAR Bond program. These nuances were not discussed with city officials during the interviews. The STAR Bond program should not be viewed through any type of “but for” analysis. Whether a district would or would not have been developed is not part of the Act.
Lastly, as the audit indicated, Commerce will continue to work with our tourism division to review the visitation data of current attractions. We will continue to utilize this data to validate potential future attractions’ projected visitation data, as presented in the feasibility study during the district approval process. Like in the past, Commerce will look for new ways to improve and fine-tune the STAR Bonds, including better defining the quality of life for evaluation processes, to make STAR Bonds an even more effective tool for growing the state and its communities.
Commerce appreciates LPA’s professionalism, thoroughness, and willingness to engage in discussion during this audit. The STAR Bond program is a valuable tool for both urban and rural communities across the state. We appreciate LPA’s evaluation of the program and look forward to utilizing the program for years to come.
Sincerely,
David C. Toland
Lt. Governor/Secretary
Appendix A – Cited References
This appendix lists the major publications we relied on for this report.
- The Conceptual and Operational Definition of Quality of Life: A Systematic Review of the Literature (August, 2004). Marvel Clark Church.
- The Determinants and Welfare Implications of US Workers’ Diverging Location Choices by Skill: 1980-2000 (August, 2015). Rebecca Diamond.
- International Handbook of Migration and Population Distribution (2016). Michael White, ed.
- Migration of Recent College Graduates: Evidence from the National Longitudinal Survey of Youth (January, 2001). Yolanda Kodrzycki.
- Moving to Nice Weather (January, 2006). Jordan Rappaport.
- The Radius of Economic Opportunity: Evidence from Migration and Local Labor Markets (July, 2022). Ben Sprung-Keyser, et al.
- A Study of Participation Motive in Outdoor Recreational Activities (March, 2017). Wirdati Mohd Radzi, et al.
- Systematic Review of Determinants of Migration Aspirations (January, 2021). Maryan Aslany, et al.
- Urban Revival in America, 2000 to 2010 (June, 2019). Victor Couture and Jessie Handbury.
- Who Stays Put? Where’s Home? (December, 2008). Pew Research Center.
Appendix B – Industry Employment Density Methodology
This appendix outlines in greater detail the methodology we used for our industry employment density analysis.
We used Department of Labor data to determine how 109 quality-of-life industries’ employment density changed.
- We chose to review the districts in Derby, Dodge City, Overland Park, Salina, and Wichita based on data availability. Commerce approved these districts or their main projects during 2012-2017. The Department of Labor unemployment insurance data we used to analyze employment in these districts was more complete and consistent from 2012 onward.
- We often use Labor data and think it’s generally reliable for our work. Labor and the federal Bureau of Labor Statistics regularly review it for accuracy. But we noted a few minor issues that we don’t think meaningfully affected our analyses. After the data cleaning we describe below, the data we used in our analysis included about 98% of statewide employment.
- We eliminated master records for multi-location employers and focused only on individual business location records. We did this to avoid double-counting jobs. For example, Walmart had records for each individual store and a master record for the entire state, which we excluded.
- We used mapping software to find each business address so we could tell which are in or near the 6 districts. We matched the addresses in Labor’s data to Kansas’s 911 address database because it’s the most accurate and complete set of addresses. We had to do this because businesses self-report their addresses to Labor, and many had typos such as transposed numbers or misspelled street or city names. Our software couldn’t locate all of them based on the 911 database, so we manually located a small number. Some errors could still exist in the data, but we don’t think they’re significant enough to affect our analysis. We excluded a small number of records without identifiable addresses.
- Labor assigns industry codes to businesses, and the federally created list of possible codes changes every 5 years. For instance, in 2017 the bookstores industry and news dealers industry had different codes. But they were combined into a single industry with a new code in 2022. Labor assigns businesses their codes based on how they describe what they do. We can’t be certain all industry codes are perfectly assigned. But they’re regularly reviewed, so we think they’re generally accurate. And the federal government publishes a crosswalk showing how these codes have changed, which we used to track industries across time. We eliminated 2 industry codes that covered very few businesses in Kansas but split about 80 ways during 2012-2023.
- We focused on 109 industries related to people’s quality of life. We compared how each industry’s employment densities changed in the 6 districts themselves as well as within 2 miles of them. We reviewed a 2-mile radius because a district’s presence may influence other businesses to locate or expand nearby as people visit the district. We limited our review to 2 miles for 2 reasons. First, we thought it was a reasonable limit to how much of a city a STAR bond district can affect. Second, we thought it was reasonable limit to apply to each of the much differently sized cities where the 6 districts are located. It didn’t cover the entirety of any of these cities, for instance. And it generally left out other major commercial areas that may grow in similar industries as the district.
- To review industries’ employment density changes, we used calculations known as location quotients. Location quotients are commonly used in economic research, including by the federal U.S. Bureau of Economic Analysis and Bureau of Labor Statistics. Location quotients divide the percentage of workers in a given industry in a smaller, local area by the percentage of workers in that same industry in a larger area. Doing so allows one to determine whether the smaller, local area is more specialized in that specific industry. For example, suppose 5% of jobs in Topeka were in full-service restaurants, but only 1% of all jobs in Kansas were in full-service restaurants. This would produce a location quotient value of 5.0 for this industry in Topeka. This would mean Topeka’s workforce is more specialized and dense in the full-service restaurant industry than the state as a whole is.
We reviewed project plans and talked to city officials to contextualize and better understand our analysis results.
- We identified which of these 109 industries directly received STAR bond financing in the 6 districts. This matters because the program has a clearer and more direct effect on any industries it provides financing. The program’s effects on other industries located in or near the districts that don’t get any bond proceeds aren’t as clear.
- We also talked to local officials to ensure we understood which industries directly received bond proceeds. And we asked for their thoughts on the role STAR bond financing played in the changes we saw. This included what might have happened without STAR bonds.
- Finally, it’s important to note we don’t know the program’s influence on the 6 districts with certainty. We can’t determine what might have happened in these cities if the STAR bonds program didn’t exist. We also didn’t attempt to assign a “but for” percentage to our analysis. But we think our work isolated the program’s effects well enough to draw general conclusions.